


 Your new post is loading...


Are you ready for the biggest information explosion in history?
If you don’t know by now, the Internet of Things (IoT) is going to take the world by storm in the coming years. A system of interconnected physical devices, IoT will enable humans, animals and man-made objects to transmit data over a network through biochip implants, built-in sensors or any other thing that can be assigned an IP address.
This means that we will soon have more real-time data at our disposal than ever before. In fact, the amount of information in the universe is expected to grow 10-fold by 2020.
What are we to do with so much information? The simple answer is that we have to get better at visualizing information in the form of data visualizations and infographics....
Via Jeff Domansky


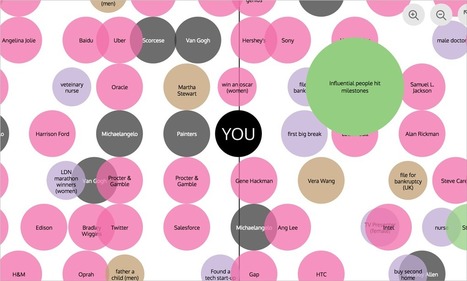
A list of the most creative and enlightening interactive information graphics and data visualizations from 2016.