
Free resource of educational web tools, 21st century skills, tips and tutorials on how teachers and students integrate technology into education
Via paul rayner
Get Started for FREE
Sign up with Facebook Sign up with X
I don't have a Facebook or a X account


 Your new post is loading...
 Your new post is loading...
Your new post is loading...
Free resource of educational web tools, 21st century skills, tips and tutorials on how teachers and students integrate technology into education Via paul rayner 
No comment yet.
Sign up to comment
|
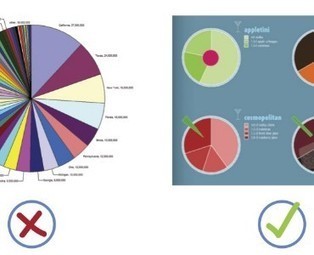
When it comes to visualizing data, it’s important to pick the right graph and the right kind of data range. Make it too detailed, and information gets lost and the reader leaves confused. Too simplified, and your data’s integrity is weakened.
Choosing the right infographic element shouldn’t be an art but common sense. After all, it’s an infographic – readers should get the gist of things at first glance and not have to get crossed-eyed in making sense of things... Via Lauren Moss

Lauren Moss's curator insight,
April 10, 2013 6:55 AM
General reference for basic visualization design elements, applications, and best practices... |