Into the Driver's Seat
454.5K views | +10 today
Follow
Into the Driver's Seat
Building learners' independence through thoughtful technology use
Curated by Jim Lerman
Your new post is loading...
Rescooped by Jim Lerman from visual data
Scoop.it!

A Guide to Infographic Elements

A Guide to Infographic Elements | Into the Driver's Seat | Scoop.it

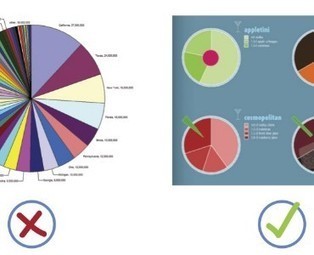
When it comes to visualizing data, it’s important to pick the right graph and the right kind of data range. Make it too detailed, and information gets lost and the reader leaves confused. Too simplified, and your data’s integrity is weakened.


Choosing the right infographic element shouldn’t be an art but common sense. After all, it’s an infographic – readers should get the gist of things at first glance and not have to get crossed-eyed in making sense of things...


Via Lauren Moss
Lauren Moss's curator insight, April 10, 2013 6:55 AM

General reference for basic visualization design elements, applications, and best practices...

Rescooped by Jim Lerman from visual data
Scoop.it!

Vintage Data Visualization: 35 examples from before the Digital Era

Vintage Data Visualization: 35 examples from before the Digital Era | Into the Driver's Seat | Scoop.it

Graphics, charts, diagrams and visual data representations have been published on books, newspapers and magazines since they've existed, not to mention old maps and scientific illustrations...


Despite the lack of tools such as the ones we have at our disposal nowadays, they are as inspiring and important as the best contemporary visualizations. Visit the article link for a gallery of vintage visualizations...


Via Lauren Moss
Mariana Soffer's comment, July 20, 2013 9:39 AM
my pleasure
Charlley Luz's curator insight, July 20, 2013 10:26 AM

muito legal, os Infográficos antes de existir a internet. 35 exemplos de infográficos no papel :) Achei falta do Marcha para Moscou do Minard http://www.datavis.ca/gallery/re-minard.php ;

Leoncio Lopez-Ocon's curator insight, July 20, 2013 2:57 PM

El brasileño Tiago Veloso, fundador de Visual Loop, nos ofrece 35 interesantísimas representaciones visuales de distintos fenómenos y eventos que permiten hacer un paseo por la historia de la ilustración científica.