Geography for All!
1.5K views | +0 today
Follow
Geography for All!
Geography that affects YOU!
Curated by Trisha Klancar
Your new post is loading...
Scooped by Trisha Klancar
Scoop.it!

Stories Displayed on Maps

Stories Displayed on Maps | Geography for All! | Scoop.it

Ok...So this is neat... Only thing is you must SIGN IN with a social media account or SIGN UP. ... It is free.

Cool way to create a visual, moving timeline. For the moment I might use this more in HIstory,but the door is completely open!


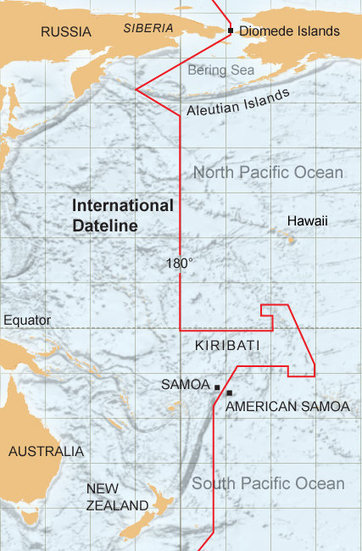
On myHistro you can create advanced geolocated timelines that you can play as presentations. Pin your events, videos and photos to the map and share them with friends and family.


This new resource, myHistro, combines interactive maps with timelines to organize stories, journeys or historical events as the move over time and place.  By embedding photos, videos and links this creates an incredibly dynamic platform for telling historical and geographic stories.  By combining these features, this is a powerful tool to create customized resources for you students.  Pictured above is a sample timeline that shows the spatial and temporal journey of the Olympic torch for the 2012 Games.   

benjamin costello's curator insight, May 20, 2015 5:38 PM

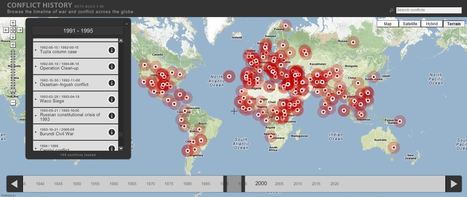
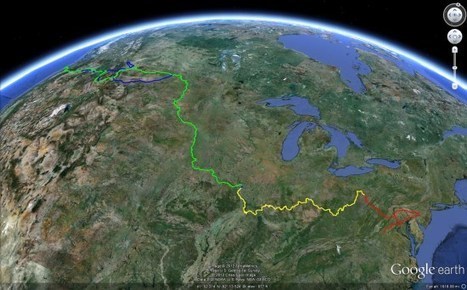
Interesting concept but not totally fleshed out for use by historians... genealogists perhaps would have a better or easier time using this program. It is very interesting but it only allows for one movement, so rather than showing the history of a nation you can show the history of a family through its interactive timelines. Google maps is not always accurate as well. 

Scooped by Trisha Klancar
Scoop.it!

Demand for Elephant Meat Threatens Populations Around the World - ForceChange

Demand for Elephant Meat Threatens Populations Around the World - ForceChange | Geography for All! | Scoop.it

I am not petitioning you, only giving you the information.!


"For years, elephants have been hunted for their valuable (and highly illegal) elephant tusks."

No comment yet.
Scooped by Trisha Klancar
Scoop.it!

Extreme Weather and Drought Are Here to Stay

Extreme Weather and Drought Are Here to Stay | Geography for All! | Scoop.it

No further link...unless you are a member BUT a great point and graphic.


It is increasingly clear that we already live in the era of human-induced climate change, with unprecedented weather and climate extremes.


I don't delight in sharing the bad news.  So is this drought just a freak anomaly or a sign of a new normal?

No comment yet.
Scooped by Trisha Klancar
Scoop.it!

A History of Conflicts

A History of Conflicts | Geography for All! | Scoop.it

 So there are a few missing...but still a fun interactive resource for teachers and kids.


Browse the timeline of war and conflict across the globe.


This database of global wars and conflicts is searchable through space and time.  You can drag and click the both the map and timeline to locate particular battles and wars, and then read more information about that conflict.  This resource would be a great one to show students and let them explore to find what they see as interesting.  This site is brimming with potential.     

olsen jay nelson's comment, August 16, 2012 7:46 AM
This is just what I've been looking for, believe it or not:-)
Sakis Koukouvis's comment, August 16, 2012 8:06 AM
Oh... You are lucky ;-)
Paul Rymsza's comment, August 22, 2012 2:15 PM
the potential of this site is amazing between the interactive learning system and the correlation between the timeline and location. If the human geography class is anything like this i can't wait for it!
Scooped by Trisha Klancar
Scoop.it!

Stuff We Like!

Stuff We Like! | Geography for All! | Scoop.it

Not sure I agree with the title..it is just that it is about many topics we like.

Video is very graphic...but nothing compared to what kids are used to seeing in one of their video games : (


"Aug 12: Today is World Elephant Day! Experts estimate that elephant populations in Central Africa declined by more than 50% between 1995 and 2007, primarily due to ivory poaching. Read more: http://wwf.to/Ojxw0E (Aug 12: Today is World Elephant Day!"

No comment yet.
Scooped by Trisha Klancar
Scoop.it!

'Sharp drop' in India poverty

'Sharp drop' in India poverty | Geography for All! | Scoop.it
Poverty in India has dropped sharply thanks to increased spending on rural welfare programmes, the country's Planning Commission says.


KV: Government intervention has decrease poverty in rural India. More people are getting out of poverty in rural areas than urban areas. Programs funded by the government to help the poor has significantly changed many lives. People are given education, welfare, and proper sanitation. Once assistance is provided to the poor, the welfare and well being drastically changes for the better. As the Indian government prospers because of new business ventures, some of the increased revenue should be set aside to help many regions that are affected by poverty.


SD: For more resources on population, the environment and society by KV, see: http://storify.com/Kimbodiantree/population-and-the-effects-on-society-and-the-envi

Bryan Tan's curator insight, February 2, 2013 10:54 AM

After reading this article, I am convinced that the gorverment in India know and want to do something about their currebt situation of being one of the poorest state in the world. Poepla are treated better given benefits, edeucation,welfare of the citizens and hygiene are all being taken care of by the gorverment. The gorvement starts improving their ties with other countries in the world helping it to gain more advantage. This helps to decrease the rate of poverty in India.

Meagan Harpin's curator insight, October 8, 2013 4:56 PM

Poverty in rural India has declined drastically, and much faster then in urban India. The decline is due to increased spending on rural welfare programmes, and rural poverty fell by 8% while urban poverty fell by 4.8%. I think this is great that the government is finally taking action and helping their people, instead of just 'sweeping them under the rug' in a way and pretending the issue isnt there.

Mark Hathaway's curator insight, November 11, 2015 11:26 AM

This is yet another sign that India is developing into a great world power. The government has sought to curb the rates of rural poverty by instituting social welfare programs.  The programs are designed to provide those living in the rural areas of the nation, with education and proper sanitation. These programs appear to be succeeding, as a sharp drop has occurred in rural poverty. The governments recognition of the poverty issue is a major step towards tackling the major inequities in Indian society. Largely a legacy of the caste system, Indian society is still terribly divided along socio-economic lines. In order for Indian to achieve the status of a developed nation, the government must take action to bridge this inequities. An new  society based on equality may be on the horizon in India.

Scooped by Trisha Klancar
Scoop.it!

July 2012 Hottest Month Ever in U.S.

July 2012 Hottest Month Ever in U.S. | Geography for All! | Scoop.it
By Climate Central's Michael D. Lemonick: July 2012 was officially not only the warmest July on record, but also the warmest month ever recorded for the lower 48 states, according to a report released Wednesday by scientists at the National Oceanic...


The drought footprint cover 63% of the contiguous states during the hottest month in American history.  It's the hottest 12 month stretch (August 2011-July 2012) on record for the lower 48, making it the fourth consecutive month to set a new record (i.e. old record was July 2011-June 2012).The biggest difference from other hot months is the nighttime temperature have been exceptionally high.  The most current drought monitor map can be found at:  http://droughtmonitor.unl.edu

No comment yet.
Scooped by Trisha Klancar
Scoop.it!

Issues from Global Population Growth

Find In-depth Review, Video And Infographic On World Population. http://www.mapsofworld.com/poll/can-world-population-be-controlled.html Learn more about pop...


This video displays some intriguing statistics about global population growth.  Equally important the video explores some concerns that are presented with a large population.  Click on the above link to view all the images as one long infographic.  Admittedly, this video (and most academic literature) approaches the population issue from a strong perspective which advocates for the reduction of total population; if you feel it necessary to have an ideological counterweight in the classroom, this article may be what you are looking for: http://opinion.latimes.com/opinionla/2011/07/overpopulation-dont-buy-more-people-more-problems-blowback.html  

No comment yet.
Rescooped by Trisha Klancar from Mr Foden's Geography updates
Scoop.it!

Three Gorges Dam Fully Operational

Three Gorges Dam Fully Operational | Geography for All! | Scoop.it

"The final 32 generators went into operation this week, making it the world's largest hydropower project, pictured, built on the Yangtze River in China."  This photo gallery has a tremendous video at the end that displays vividly the raw power that moves the turbines.  Economically, what are the benefits? Environmentally, what are the costs?    


Via John Foden
Amanda Morgan's curator insight, December 15, 2014 4:07 PM

The three gorges dam displays the extraordinary things man can do to manipulate the environment.  This man made dam also shows how much technology influences our geographic space. 


Scooped by Trisha Klancar
Scoop.it!

The Border That Stole 500 Birthdays

The Border That Stole 500 Birthdays | Geography for All! | Scoop.it

Little tid-bit of information for kids ....something quick to have on the smart board as they come in and read it...how Geography can affect something like YOUR BIRTHDAY!


"The story behind the the International Date Line."


Not too long ago (Jan. 2012), the arbitrary International Date Line (roughly opposite the Prime Meridian) was moved to better accommodate the regional networks and economic geography of the area straddling the line.  American Samoa, although politically aligned with the United States, was functionally more integrated on the Asian side of the Pacific Rim when it came to their trade partners and their tourism base.  Dynamic economic networks, political allegiances and cultural commonalities create a beautifully complex situation near this 'border.'    

Edgar Manasseh Jr.'s curator insight, May 1, 2015 8:06 PM

500 birthdays were taken away due to an international date line. In Samoa is in a confused state between the united states and the Asian pacific side of the timeline which would cause time and dates to be confusing.Dynamic economic networks and political allegiances have created a very difficult situation for the people near the border in Samoa.  The International Date line in Samoa is something that is needed to be watched and paid attention because it can affect people in ways that can be very significant even at a small tiny rate.

brielle blais's curator insight, April 26, 2018 1:33 PM
This post shows the importance of trade to each country, so much so that Samoa was able to get the International Dateline changed to accommodate their trade needs, skipping a day and allowing easier economic networks with China and Australia, who are important trading partners. 
Stevie-Rae Wood's curator insight, December 9, 2018 11:11 PM
The International date line is a tricky situation, initially more thought should have been put into it considering it is just a straight line right down the middle of some islands. One could be next door neighbors with someone who's calendar day is Saturday while they are already are on Sunday. Talk about jet lag.  
Scooped by Trisha Klancar
Scoop.it!

GeoThentic {Geospatial Technologies + Authentic Learning}

GeoThentic {Geospatial Technologies + Authentic Learning} | Geography for All! | Scoop.it

A fantastic fun interactive site for teachers and kids. Thanks National Geographic!

No comment yet.
Scooped by Trisha Klancar
Scoop.it!

Experiencing World Regional Geography

Experiencing World Regional Geography | Geography for All! | Scoop.it
Two hundred countries and 20 times around the planet - a man's amazing journey in his Mercedes.


This 5 minute video is a glimpse into the life and travels of Gunther Holtorf, on a 23-year, 500,000 mile journey.  This man has experienced, lived and seen so many of the places, cultures and environments that we try to make come to life for our students as we study the wonderful world we live in.   

No comment yet.
Scooped by Trisha Klancar
Scoop.it!

Geography is Key

This video is a class introduction to the Advanced Placement course in Human Geography, which is intended to give high-ability students the opportunity to ea...


This is an excellent promotional video for geography as a whole, but the AP Human Geography course specifically.  For more from this great Florida teacher, visit his course website at: http://teacherweb.ftl.pinecrest.edu/snyderd/APHG/ which has some incredible resources. 

No comment yet.
Scooped by Trisha Klancar
Scoop.it!

A Look into the Causes of Poverty in the U.S.

A Look into the Causes of Poverty in the U.S. | Geography for All! | Scoop.it

Although an American study... things can't be that different for Canda.


"Are more and more people in the western world dropping off the radar and becoming the invisible poor or is the opposite happening?  We recently heard that an astounding 46 million Americans are officially below the poverty line (That's $23,050/year for a family of four according to the official sources).  That number really caught our eye and as such we decided to do a little more digging to help put some more facts and figures around it.  Above is a nice visualization of the results we came up with."

Ivan Koh's curator insight, February 3, 2013 7:37 AM

This is my insight using See-Think-Wonder.
From this statistic, i can see alot of statistic about the number of people who are poor and the people's opinion related to poverty and welfare. In the article, i can see that 46million american are considered to be poor, and form the authors opinion, to prevent porverty, we should manage our wealth and make sure that we earn more than we spend.

I think that from the statistics, most people are poor mostly due to the fact that  they were uneducated in alot of ways. From the statistics, 1.2 million students drop out from high school every year. Thus, these people were mostly uneducated and cannot find a proper job, leading to drugs and borrowing of money. i also think that most people are poor because they are lazy and do not want to help themselves, as agreed by half of the americans that the poor are not doing enough to help themselves, and by 43% of americans that people who are poor can find a job if they are willing to work.

This article and statistics makes me wonder why american governments are not doing enough to educate students the importance of jobs and studies. Because people who are poor can actually work, but are too lazy to do it, this also makes me wonder why the government are giving money to the poor when they are able to help themselves 

Brandon Lee's curator insight, February 4, 2013 10:36 AM

The insight of this article merely showed that more and more people does not really have  a good financial health, which also has translated into people wer e "invisible poor" especially those living in the western world. Comparison had been made on its poverty line between USA and UK statistics.

In my opinion, managing a country's budget its not an easy task, this is because a country need competitive global presence and to boost the economy. People need to produce more and more services outside its own country.

I have often thought that a country's population does have an impact on a country's economic growth.

Tim Stark's curator insight, October 24, 2015 9:54 PM

Great visual for economics and sociology courses

Scooped by Trisha Klancar
Scoop.it!

Arctic ice could vanish in 10 years, scientists warn | Sympatico.ca Sync.ca

Arctic ice could vanish in 10 years, scientists warn | Sympatico.ca Sync.ca | Geography for All! | Scoop.it
Arctic sea ice is melting at a pace so much faster than once thought that the latest projections say it might disappear by as soon as 2022, according to measurements from the European Space Agency.
No comment yet.
Scooped by Trisha Klancar
Scoop.it!

Back to School with Google Earth

Back to School with Google Earth | Geography for All! | Scoop.it

If you aren't using Google Earth... YOU SHOULD BE!


Amazing things about Google Earth - news, features, tips, technology, and applications...


If you've never seen the Google Earth Blog, this post is a good primer to the educational possibilities that this technology opens up to teachers.  It is not just for geography teachers; it can be a visualization tool for any subject that has real-world applications that take place somewhere. 

No comment yet.
Scooped by Trisha Klancar
Scoop.it!

Not all Olympic champions stand on the podium

Not all Olympic champions stand on the podium | Geography for All! | Scoop.it

Amazing read, thank you! Where everyone's focus should really be!


"Tahmina Kohistani’s Olympics lasted exactly 14 and 42/100ths of a second.


This is a great article that highlights the Olympic successes that are underreported.  Due to geographic circumstances, simply competing is a remarkable accomplishment.  The women participants from Afghanistan and Iran are highlighted in this article. "

Meagan Harpin's curator insight, October 2, 2013 12:41 PM

The olympic games have become only about the podium winners in the media, if you dont win you dont matter. Tahmina Kohistani was the only female athlete from Afghanistan to compete in the games back in 2012. It is an amazing feat in itself that a female from Afghanistan even managed to get to the games never mind partacipate. She didnt win, she finished last, but it was her personal best time and the fastest she had ever run the 100 meter. But because she was not up on that podium none of that matter and many people did not even know she had run the race.  

Kendra King's curator insight, February 28, 2015 11:12 AM

The coverage of the Olympics after opening ceremonies is heavily centered on the medal count and I don’t actually see a problem with that. Reason being is that the story, that supposedly never got coverage, was something I remember commentators speaking about when the Afghanistan team walked out on stage during the opening ceremonies thereby showing how “politics and social culture” are intertwined. Her journey qualified her as a “champion” right away and people saw that. Secondly, when there is a ridiculous amount of events and people to cover, one needs to pick and choose. Since the point of the Olympics is to win, it isn’t surprising that the most coverage is given on the metal winners. There are stories outside of Kohistani’s in which someone who didn’t make it to podium was covered (i.e. winter Olympics regarding Ryan Bradly or Jonny Wier). Typically when that happens though, the person is from our own country. What I think is wrong with the coverage is the huge focus on just our country. While the Olympics is a time where patriotism surges as we root for our own team, it is a symptom of a large problem. Americans are too America-centric in general. Just looking at the normal daily news cover in the states is a clear indication of the issue and I think that is why some of the more analytic pieces that show “politics and social culture” are generally under reported

Scooped by Trisha Klancar
Scoop.it!

Spotzi, spot, zoom in and explore

Spotzi, spot, zoom in and explore | Geography for All! | Scoop.it

This is really cool! Thanks to Peggy for the link!


"Online World Atlas: Weather maps, Animals, World Bank data and more. Measure distances and view satellite images."

No comment yet.
Scooped by Trisha Klancar
Scoop.it!

NOAA upgrades forecast, boosts estimate of named storms | Sympatico.ca News

NOAA upgrades forecast, boosts estimate of named storms | Sympatico.ca News | Geography for All! | Scoop.it
Forecasters are predicting another six to 11 major storms through the remainder of the Atlantic hurricane season.
No comment yet.
Scooped by Trisha Klancar
Scoop.it!

The Importance of Place

The Importance of Place | Geography for All! | Scoop.it

Make it real!


"Using the vocabulary of this course, please describe in detail the geographic context of a town like this (real or imaginary).  What is the town like?  How did it get that way?  What type of meaning does 'place' have for those that live there?  "

No comment yet.
Scooped by Trisha Klancar
Scoop.it!

HowStuffWorks "Geography Facts"

HowStuffWorks "Geography Facts" | Geography for All! | Scoop.it

Fun things to write at the bottom of note pages, or on the board as kids come in...

Geography facts will teach you about everything from the Dead Sea to Burundi. Gain some geography facts credibility from HowStuffWorks.

No comment yet.
Scooped by Trisha Klancar
Scoop.it!

Global CO2 emissions

 Great visual for kids ( and adults) learning about climate change and what we are doing to continue global warming.

"Animated time-lapse video of anthropogenic carbon dioxide emissions in map form, spanning the 18th century until this current first decade of the 21st centur...


This is not a complete data set, but the video still shows the striking connection between CO2 emissions and  the historical geography of industrialization."

Rafael CAYUELA's curator insight, February 3, 2014 3:18 PM

Interesting and well done..

Scooped by Trisha Klancar
Scoop.it!

Canadian Geographic Photo Club - Canada's photography community

Canadian Geographic Photo Club - Canada's photography community | Geography for All! | Scoop.it

Great way to turn summer vacation pictures into a fun Geography project.  There are always some kids looking for something EXTRA to do ...here it is!


"Canada's photography community..."

No comment yet.
Scooped by Trisha Klancar
Scoop.it!

Infographic: global refugee populations 1975-2010

Infographic: global refugee populations 1975-2010 | Geography for All! | Scoop.it

When we click on the world map it becomes interactive...really visual for kids!


"35 years of refugee crises, charted on an interactive map."

No comment yet.
Scooped by Trisha Klancar
Scoop.it!

Understanding "Eat Local"

Understanding "Eat Local" | Geography for All! | Scoop.it

This Oregon-based infographic succinctly summarizes the local food movement and taps into the cultural ethos that permeates the growing number of consumers that are demanding more home-grown products.

No comment yet.