21st Century Tools for Teaching-People and Learners
103.0K views | +0 today
Follow
21st Century Tools for Teaching-People and Learners
21st Century Tools to help teaching-people and learners to achieve "BETTER" their tasks...
Curated by Gust MEES
Your new post is loading...
Suggested by Damián Casado
Scoop.it!

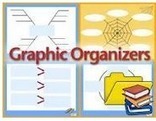
Teachers Guide on The Use of Graphic Organizers in The Classroom

Teachers Guide on The Use of Graphic Organizers in The Classroom | 21st Century Tools for Teaching-People and Learners | Scoop.it

Gone are the days when planning and thinking were done mainly by pen and paper.Technology have made it pretty much easier to think in different other ways. Free mind mapping , brainstorming and concept mapping applications are ubiquitous online and more and more teachers are using them . The 21st century education is based , on a large part of it, on the visual output.


The benefits of graphic organizers in education


- Teachers can use graphic organizers to engage visual learners and help them organize their thoughts


- Graphic organizers help students make powerful connections between ideas and concepts


- They help students develop their convergent thinking by providing a framework for the development of new ideas through analysis, reflection and display.


- They also help students promote their divergent thinking by using such techniques as brianstorming to generate ideas.


- They can be used for developing vocabulary skills and improve reading, writing and communication skills.


- Students can easily learn new concepts and think in new novel ways using graphic organizers


- They help students focus on connections rather than words 


- Finally , graphic organizers can help both teachers and students develop creative and critical thinking skills.


Read more:

http://www.educatorstechnology.com/2012/06/teachers-guide-on-use-of-graphic.html


No comment yet.
Rescooped by Gust MEES from Digital Presentations in Education
Scoop.it!

CIRCOS - Software for Data Visualization

CIRCOS - Software for Data Visualization | 21st Century Tools for Teaching-People and Learners | Scoop.it

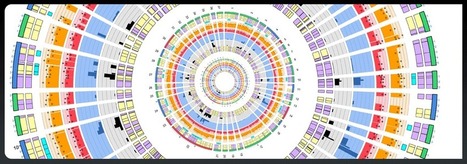
Circos is a software package for visualizing data and information. It visualizes data in a circular layout — this makes Circos ideal for exploring relationships between objects or positions.

Circos is ideal for creating publication-quality infographics and illustrations with a high data-to-ink ratio, richly layered data and pleasant symmetries. You have fine control each element in the figure to tailor its focus points and detail to your audience.


Via Baiba Svenca
No comment yet.
Scooped by Gust MEES
Scoop.it!

Graph Visualization and Social Network Analysis Software

Graph Visualization and Social Network Analysis Software | 21st Century Tools for Teaching-People and Learners | Scoop.it

Why TouchGraph?


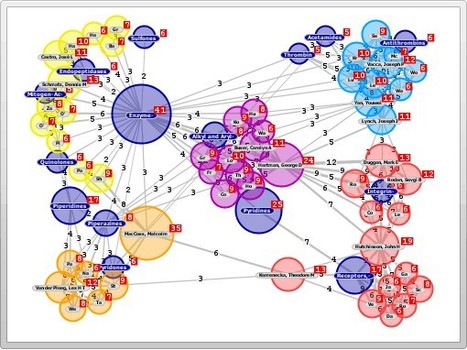
TouchGraph's approach is unique because our highest priorities are utility and ease of use. We start with the premise of a scientific or business application, and work to create a clear and intuitive interface that gets our customers the results they need. We avoid superfluous artistic effects in favor of a clear presentation.


Our applications are designed to simplify navigation, filtering, and visual metaphors. They reveal important relationships and details in your data without reducing the richness of the information itself.

S. Atyia Martin's curator insight, November 9, 2013 10:13 PM

Possible tool for thesis...

Manfred Terler's curator insight, October 1, 2018 4:12 AM
Share your insight
Scooped by Gust MEES
Scoop.it!

StatPlanet Map Maker – Interactive Mapping & Visualization Software

StatPlanet Map Maker – Interactive Mapping & Visualization Software | 21st Century Tools for Teaching-People and Learners | Scoop.it
Map maker software for creating fully customizable interactive flash maps. StatPlanet also comes with over 250 world development indicators which can be visually explored, and used as free educational software.
No comment yet.